Finance automation portfolio · 2026

Operating data
Accounting logic
Decision surface

Finance,
automated.

I automate the work between raw operating data and the final P&L—so finance teams spend less time assembling the answer and more time acting on it.

05Finance systems
05Decision surfaces
01Control philosophy

The common thread

Not automation for speed alone.
Automation for financial clarity.

01 · Reduce manual consolidation02 · Make control logic visible03 · Preserve the audit trail04 · Move decisions closer to data

Choose a system

01Manpower02Income03Gross margin04C2D accounting05Inventory

Selected work

Five systems.
Five finance problems solved.

These recruiter-safe demonstrations preserve the workflow, control design and interaction patterns while using entirely illustrative data—no employer information or live systems are exposed.
01

Workforce planning → P&L

Manpower Dashboard

A hiring plan is not a forecast until the salary cost lands in the right P&L.

This system turns employee status, functional ownership and salary cost into one planning surface for Procurement, Sales and Operations across Wholesale and Retail.

Salary projectionNew / active / leftFunction drill-downActuals view

What changes for finance

Finance can move from a company-wide run-rate to the exact business, function, sub-category and designation driving the cost—without rebuilding the bridge every month.

01Multi-entity cost model02Status-aware headcount03Wholesale + Retail
Enter the fixed dashboard

The friction

Headcount lived away from the forecastHiring movement and salary assumptions were hard to translate into a consistent business-wise P&L view.

The automation

One hierarchy, from company to designationThe dashboard applies business and function logic once, then lets the reviewer drill from total manpower cost to the operating layer underneath.

The finance unlock

Run-rate questions become clickableControllers can isolate the cost movement, challenge the role mix and compare actual manpower before the forecast is locked.
Interactive recruiter demoIllustrative data · Full interaction opens on click
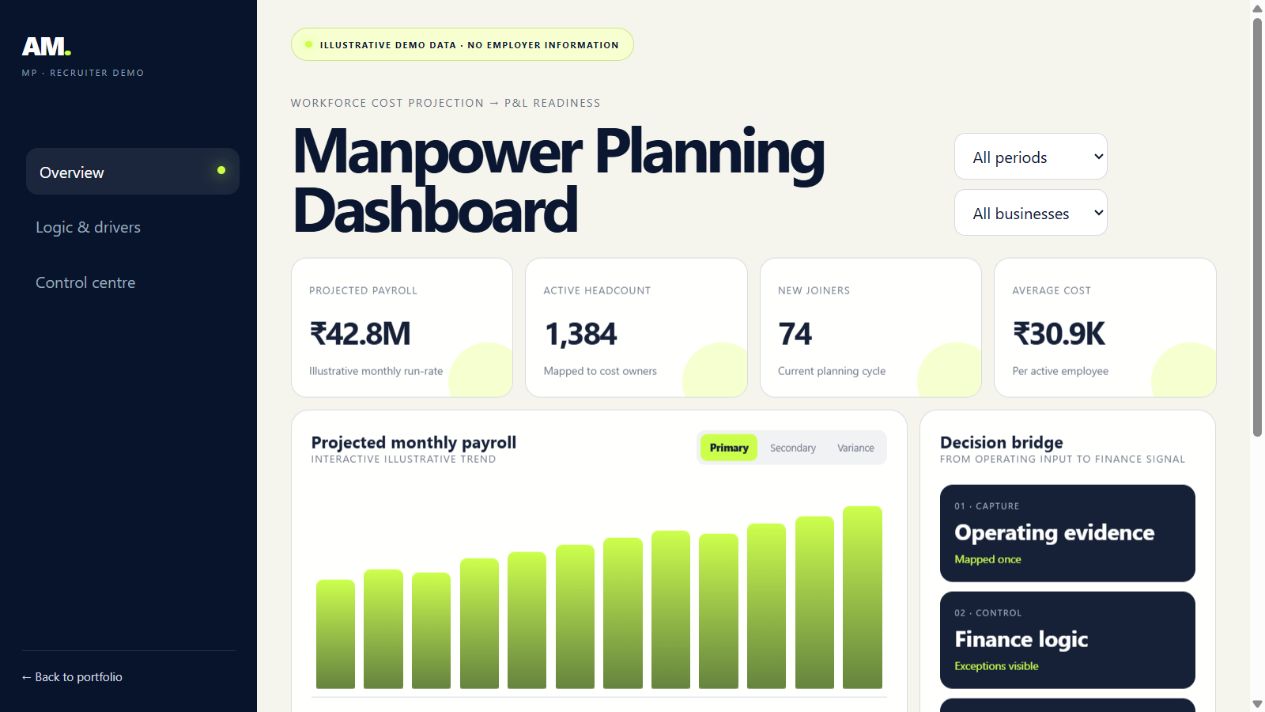
Manpower Dashboard dashboard previewOpen interactive dashboard

How value moves

01Employee inputs02Business mapping03Salary logic04P&L projection
02

SAP postings → income MIS

Income Converter Tool

SAP records every posting. The P&L needs the right posting, mapped to the right income story.

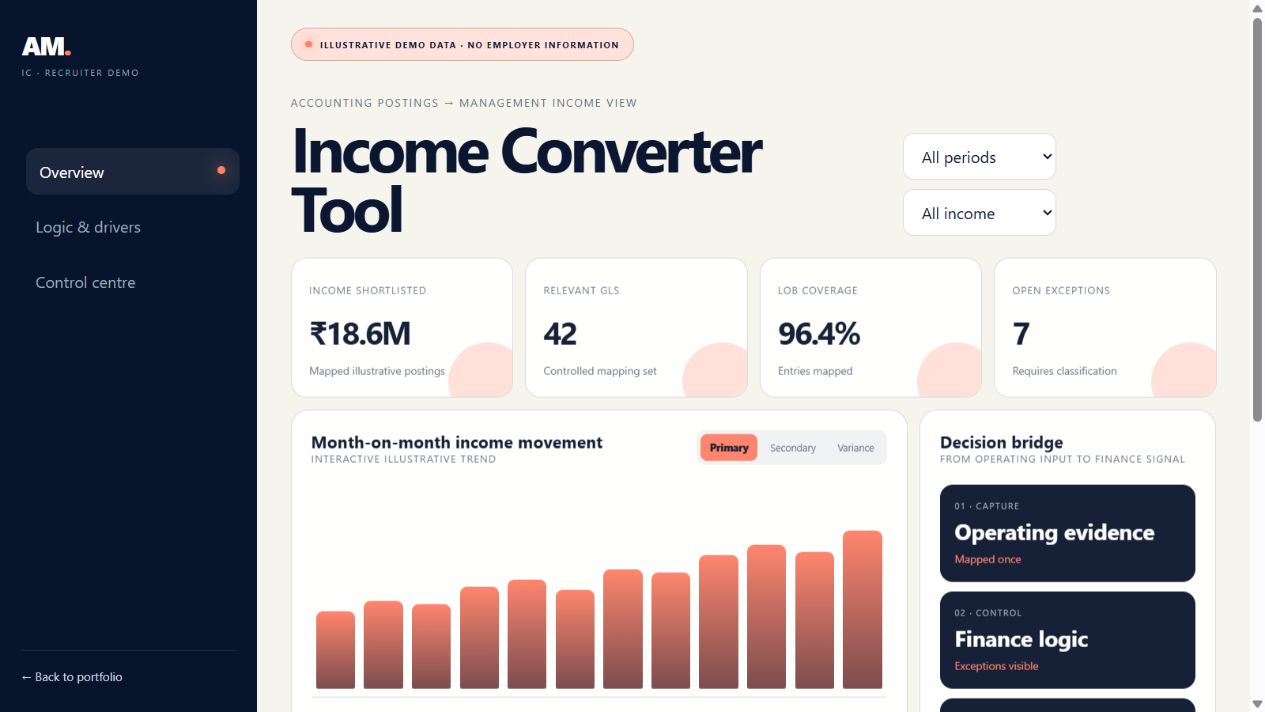
A controllership workflow that shortlists relevant income GLs from the MIS, maps them to lines of business and converts accounting entries into a review-ready dashboard with month-on-month movement.

SAP / GL filteringLOB mappingMoM trendsIncome drill-down

What changes for finance

Instead of scanning the full posting universe, reviewers start with the income that belongs to their P&L and can move directly from the trend to the GL-level explanation.

018 income views02GL-level traceability03MoM by LOB
Enter the fixed dashboard

The friction

The MIS was broader than the questionThe relevant income lines were buried inside a much larger accounting population, slowing every review cycle.

The automation

Shortlist, classify, explainA repeatable mapping layer converts posted entries into focused income categories and a consistent LOB view.

The finance unlock

Movement comes with a trailA reviewer sees what changed month-on-month and can immediately trace the movement back to the contributing income category.
Interactive recruiter demoIllustrative data · Full interaction opens on click
Income Converter Tool dashboard previewOpen interactive dashboard

How value moves

01SAP postings02GL shortlist03LOB mapping04MoM explanation
03

Snowflake → Python → decision cockpit

C2B Gross Margin Cockpit

Volume without margin is only half the operating story.

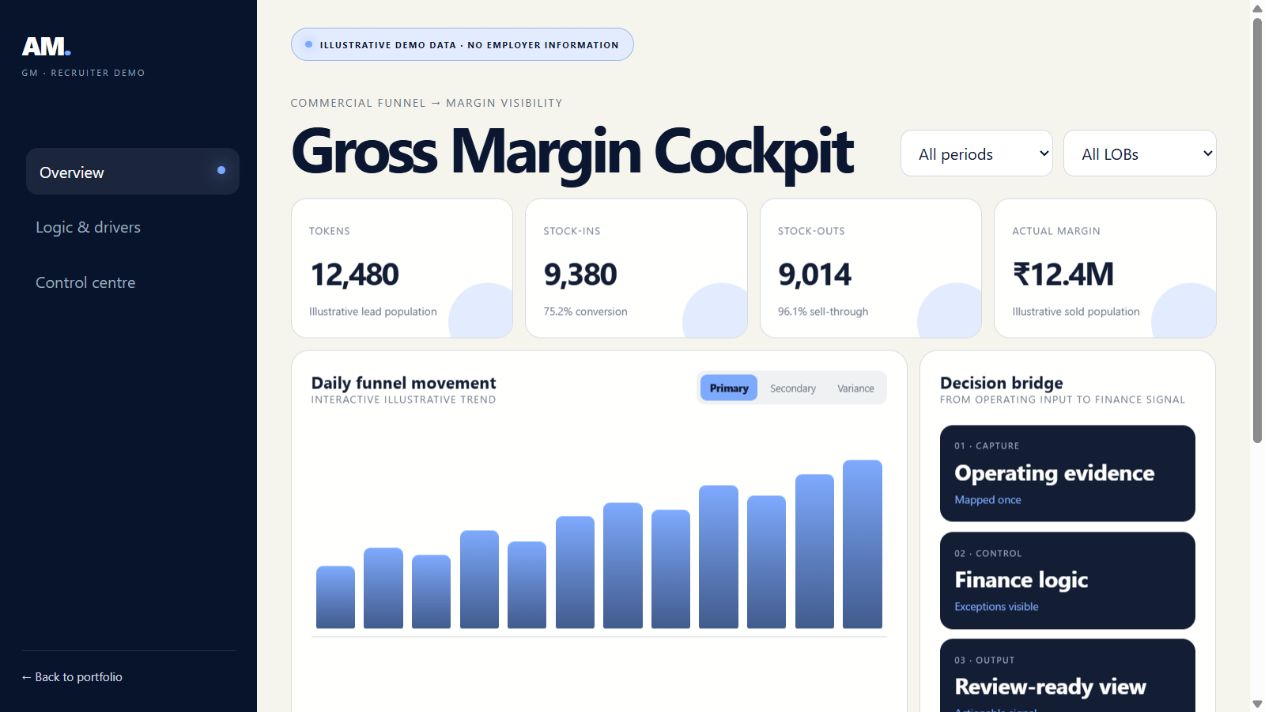
A Python pipeline runs Snowflake queries, applies the LOB hierarchy, shapes audit datasets and publishes a self-contained commercial cockpit spanning token, stock-in, stock-out, GMV and margin.

Automated data buildLOB classificationMargin bridgeAudit exports

What changes for finance

Operating funnel and profitability sit in the same view, so teams can see where volume converts, where value leaks and which region, centre or LOB needs action.

017 LOB views02Token → stock-out03HTML + Power BI

Power BI version in development

Enter the fixed dashboard

The friction

Funnel and profitability spoke separatelyQuery outputs could explain volume or margin, but not the complete commercial movement in one refreshable surface.

The automation

The pipeline builds the narrativePython executes the queries, classifies every row, derives the measures and packages both the cockpit and its audit-ready companions.

The finance unlock

Every filter is a commercial questionLOB, region and centre filters connect conversion, GMV, actual margin, contribution margin and inventory loss.
Interactive recruiter demoIllustrative data · Full interaction opens on click
C2B Gross Margin Cockpit dashboard previewOpen interactive dashboard

How value moves

01Snowflake SQL02Python shaping03Metric layer04HTML / Power BI
04

Lead-fee events → recognised revenue

C2D Accounting Dashboard

Revenue recognition is not a monthly total. It is a sequence of events that must survive control logic.

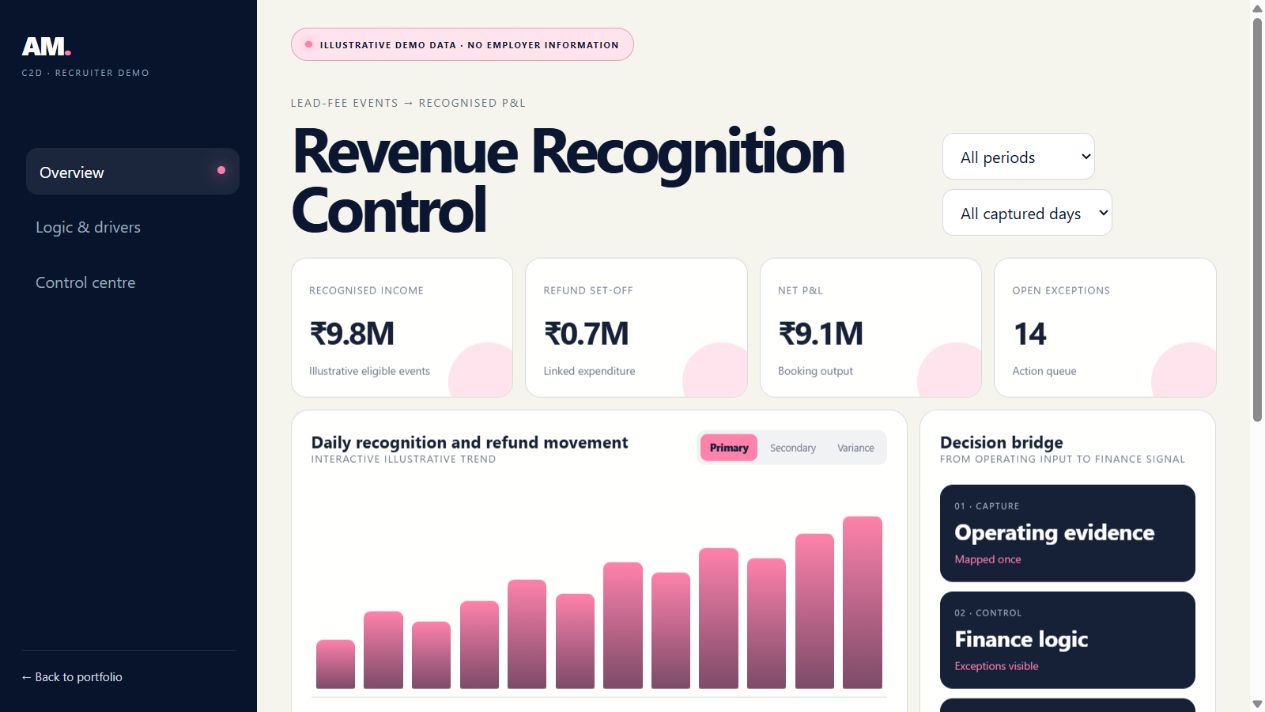
A live accounting control for validating lead-fee recognition, setting off refund-linked expenditure and surfacing technology exceptions before unbooked income or refunds reach the close.

Recognition rulesRefund set-offDaily trendsException control

What changes for finance

Finance gets a day-level view of recognised income, refunds and net P&L, backed by a workbook structure that can still trace the logic down to the underlying event.

0131 captured days02Income − refunds03Daily control view
Enter the fixed dashboard

The friction

Realisation, recognition and refund were different eventsLead-fee income could not be booked safely until the revenue criteria and any linked refund were evaluated together.

The automation

The workbook behaves like a control engineSource, working and summary layers evaluate the sequence and convert it into daily recognition and reconciliation outputs.

The finance unlock

Open items become an action queueThe close starts with what is recognisable, what must be set off and what still needs investigation—not with a manual hunt.
Interactive recruiter demoIllustrative data · Full interaction opens on click
C2D Accounting Dashboard dashboard previewOpen interactive dashboard

How value moves

01Lead-fee event02Recognition rule03Refund set-off04P&L booking
05

Books + ground → one control workspace

Inventory Management Hub

Inventory risk appears when accounting and physical reality stop telling the same story.

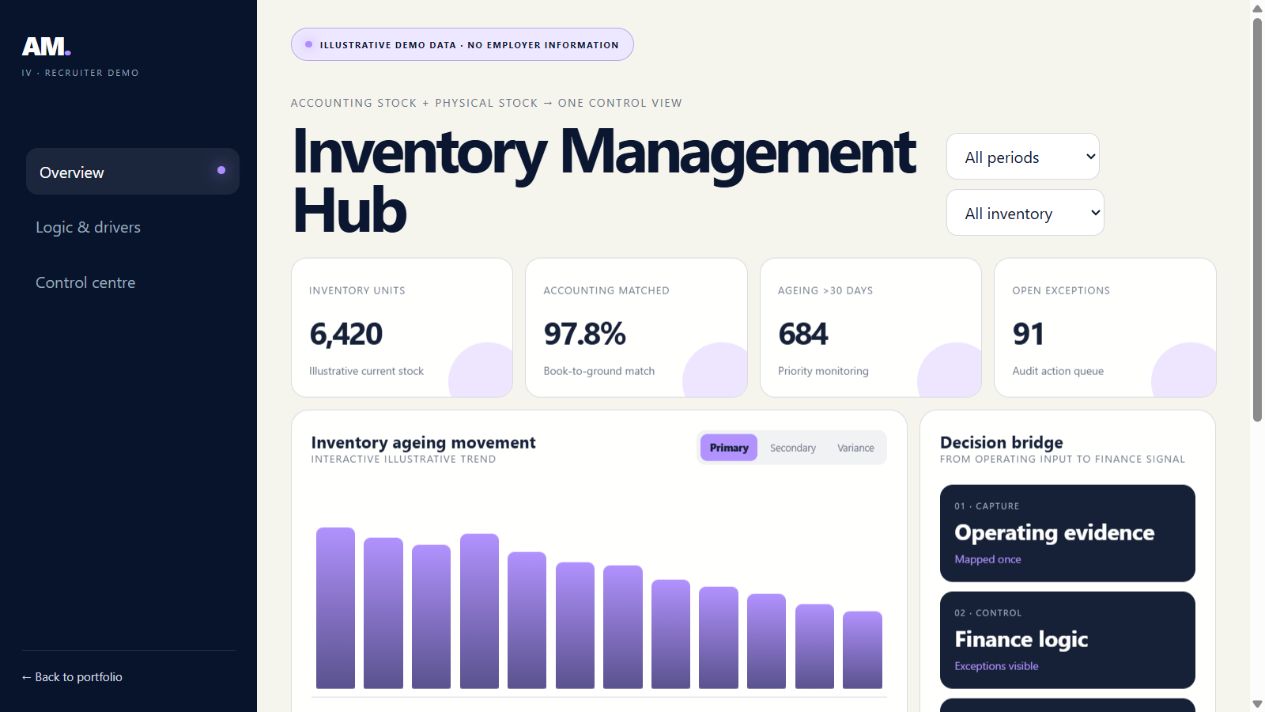
The updated Inventory Hub brings live inventory monitoring, ageing and audit workflows into one operations workspace—with anomaly detection and an AI assistant already mapped as the next layer.

Inventory hubLive KPIsAgeingAudit workflow

What changes for finance

Controllers can move from the management hub into the real inventory view, compare ageing and source-level KPIs, and prioritise exceptions before close-time reconciliation.

012 available modules022 upcoming modules03Ageing + audit
Enter the fixed dashboard

The friction

Monitoring and audit were separate journeysInventory count, ageing and vehicle-level investigation needed a common entry point for faster control decisions.

The automation

One workspace routes every inventory jobThe hub organises monitoring, audit and future intelligence modules while preserving the detailed fixed dashboard behind the live-inventory entry.

The finance unlock

The exception path is shorterA reviewer moves from portfolio-level health to the affected inventory population without leaving the control workspace.
Interactive recruiter demoIllustrative data · Full interaction opens on click
Inventory Management Hub dashboard previewOpen interactive dashboard

How value moves

01Inventory sources02Management hub03Ageing / audit04Exception action

What makes the builds different

The dashboard is the last mile.
The control design is the real product.

01

Built around the close

Every view starts with the P&L question, reconciliation gap or operating decision—not with a chart type.

QUESTION → LOGIC
02

Exceptions have a destination

A useful automation does not just flag a mismatch. It makes the next action and owner obvious.

FLAG → ACTION
03

Drill-back is preserved

Summary numbers remain connected to business, LOB, function, date, GL or source logic wherever the control requires it.

SUMMARY → SOURCE
04

The surface follows the user

Apps Script, Sheets, Python HTML or Power BI—the build lives where the review and operating rhythm already happen.

WORKFLOW → TOOL

From messy source
to trusted signal.

Each automation follows the same discipline: frame the finance question, connect the operating evidence, encode the rule and leave a controlled decision surface.

01

Frame

Define the P&L question, control gap and action the output must support.

02

Connect

Bring together source systems and operating hierarchies without losing traceability.

03

Encode

Turn the repeatable accounting or planning logic into an auditable workflow.

04

Operate

Publish the signal where the team can review, challenge and close the loop.